I would have never realized the relevance of the EmptyPoint property in the Chart Series until I hit the issue while performance tuning of one such SSRS report for a customer.
Here is the background,
The SSRS report we intend to tune consists of Line graph to measure the pageviews across months for different site. I have created the repro with dummy data in my environment. The report looks something similar as below
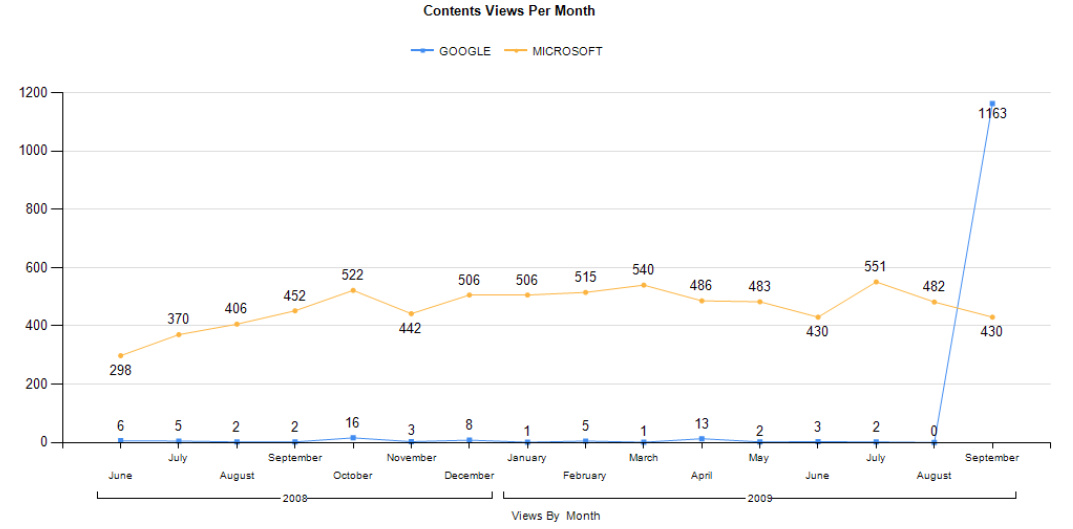
This report computes the count of the PageViews Grouped by Month which forms the X axis and Site which forms the series.
To performance tune the report we should avoid aggregating, grouping or sorting the data at the reporting layer since although SSRS allows flexibility to Group & Sort the data, the rendering of the report is rather faster when the data is grouped & aggregated from the data source.
If we bring Detailed data from the Data source & group it & sort it at the SSRS layer, we fetch large number of rows from the data source which also adds network traffic if SSRS is installed on the separate box and further grouping & sorting at the SSRS layer is slower which results into slow rendering performance of SSRS report.
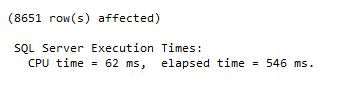
The original Dataset query for the above report is as following
SELECT     Pageid, YEAR(REQUEST_DATE) AS YearView, DATENAME(MONTH, REQUEST_DATE) AS MonthView, MONTH(REQUEST_DATE) AS MonthSort,Site
FROM         PageViews
WHERE     (Pageid = 4128842) AND (REQUEST_DATE >= '07/01/2000') AND (REQUEST_DATE <'10/01/2009')
ORDER BY REQUEST_DATE
We rewrote the query as follows, to aggregate and group the data in the Dataset itself so we just need to plot it in Chart in SSRS Report
SELECT count(MONTH(REQUEST_DATE)) as Pageid,
YEAR(REQUEST_DATE) AS YearView,
DATENAME(MONTH, REQUEST_DATE) AS MonthView,
MONTH(REQUEST_DATE) AS MonthSort, Site
FROM PageViews
WHERE (PageID = 4128842 ) AND (REQUEST_DATE >= '01/01/2009') AND (REQUEST_DATE <= '01/01/2010')
group by YEAR(REQUEST_DATE), MONTH(REQUEST_DATE), DATENAME(MONTH, REQUEST_DATE), Site
ORDER BY YearView,MonthView
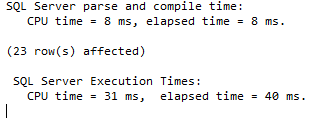
The best part of above query is, the query executes in 40ms as compared to 546 ms taken by previous query, it bring less data and hence lesser network traffic and more importantly we have grouped and aggregated data which SSRS needs to plot in chart and render it in report.
So we had a tuned query which bring aggregated data, hence we removed grouping and aggregation from SSRS Report. Now when we render the report, the report renders very fast, but we observed the following
We observe a break in the graph while plotting the line graph for the Site GOOGLE. We didn’t observe this when the data is grouped & aggregated at the SSRS layer. So lets understand why this happens, when I look back at the aggregated data fetched from Dataset we observe the following
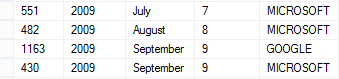
As seen in the above output, we didn’t have any PageViews for Site GOOGLE in the month of August and hence there is no data records for August for the Site GOOGLE which leads to the break in the line graph for GOOGLE.
So, how we deal with Empty Data points in the Datasets, that is where I discovered EMPTY Points Property in the Chart explained in the following article
http://msdn.microsoft.com/en-us/library/dd207051.aspx
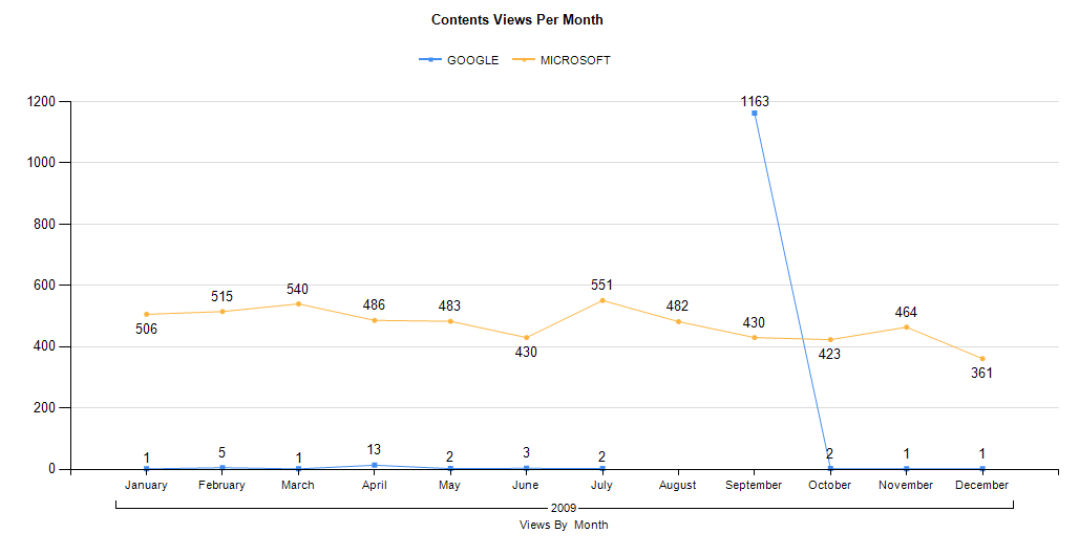
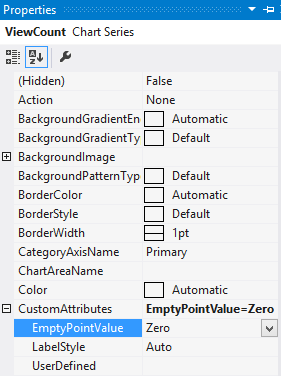
So we changes the Emptypoint property to Zero under CustomAttributes in Chart Series Properties so that if the Data point is empty it should be treated as Zero
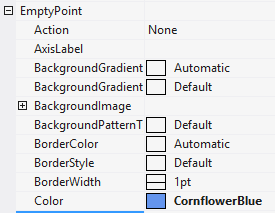
Next, we set the Color property of the Empty point values to match the color of the series of the Line graph
Next, set the Label property to display the value as Zero in the graph (Visible=True & UseValueasLabel=True)

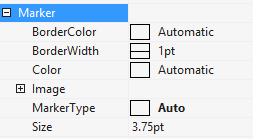
Finally set the Marker Type to Auto as shown
After setting the CustomAttributes as EmptyPoint=Zero, Color,Label & MarkerType propeties, we were able to overcome the line breaks as shown below

Thus we were able tune the SSRS Report without impacting the end user viewing experience with the help of this silent hero EmptyPoint property
Hope this helps !!!
Parikshit Savjani
Premier Field Engineer